
At some point, student’s have to start writing equations. This is just a quick look into how we think about student’s written equations to figure out how they are thinking and what we can do to help.
First, it may be useful for you to look at the differences between a multiple choice and non-multiple choice question of having students write an equation for a graph to see how much more you can understand about a student by having them write than by having them use multiple choice.
Let’s jump right in and look at some student work!

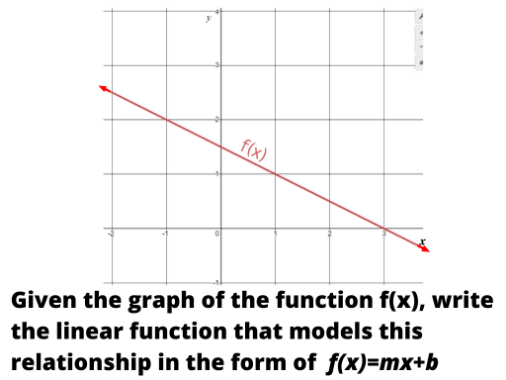
Students were given the above question, what do you think they wrote?
f(x) = 3x + 4
Student Answer
y = 3/5x + 4
Student Answer
x goes up every 5 so x=5 y goes up every 3 so y=3
Student Answer
f(5)=5x+3
Student Answer
What do you notice about each of these student answers? What do you wonder?
We think pretty deeply about how students got to every answer, but its also useful to pull back and think about what are you looking for?
At this point in time, we think about linear equations in four ways.
- What rate of change/slope did you get?
- What starting value/y-intercept did you get?
- What form did you write your equation in?
- Does it matter in what context you are given this type of question (table, graph, situation, points)?
The reason we think about equations in this way is so that we can better understand student think, more readily re-engage students in a productive conversation pertaining to their biggest challenge right now and to understand where we can start with their strengths to help them better abstract the knowledge they already have.
What rate of change/slope did you get?
With the above table, the most popular rates of changes written in their equations were:
| Rate of Change | % Of Students |
| 3/5 | 25.4% |
| 5 | 22.5% |
| 3 | 12.7% |
| m | 2% |
And there are a bunch more, like 7, 2, 5/3, -3/5, etc. But the important part is to think about where students are getting these numbers. They aren’t coming from nowhere.
3/5 is the right answer, great job students. But 5 is the rate of change per row on the x value, 3 is rate of change per row for the y value, m was in the formula we asked them to write, 5/3 is the rate of change of x per y. Students are coming up with answers, and many of them are close, but just need some guidance to looking at the change in y per 1 unit of x.
The other benefit of this is that students can see progress. Instead of just getting it wrong, you can give direct feedback on slope, from great job to “Let’s talk about what m means in mx + b”.
A good way to re-engage students here is to rewrite the question using their different slopes.
| x | f(x) = 3/5x + 4 | f(x) = 5x + 4 | f(x) = 3x + 4 | f(x) = mx + 4 |
| 5 | 7 | 29 | 19 | 5m + 4 |
| 10 | 10 | 54 | 34 | 10m + 4 |
| 15 | 13 | 79 | 48 | 15m + 4 |
| 20 | 16 | 104 | 64 | 20m + 4 |
What starting value/y-intercept did you get?
For this question, we are just going to look at the y-intercept. We pulled out the “b” from students equations and the put them on a graph.

Here, we see a bunch of interesting y-intercepts. (0,3) is 1.5 divided by 1/2 (the absolute value of the slope). (0, 2) is 1.5 + 1/2 or 2 may come from where the line nicely intersects whole numbers on a graph. (0,1) is 1.5 – 1/2 or where the line nicely intersects. (0, 2/3) is the inverse of 3/2 (1.5). And (0, 0.5) is the slope.
Not only can you use this representation to show the students all the different y-intercepts they got, but also acknowledge that they are trying, they are on the right track in some cases and then to talk about how you know what the value of b is. An incorrect answer doesn’t mean students don’t know anything, they could just be a step or 2 short and just need a point in the right direction.
What form did you write your equation in?
Looking at the last question, we asked for an equation to be written in f(x) = mx + b.
We got back a variety of answers in the following forms.
- f(x) = mx + b
- y = mx + b
- f(x) = m + b
- f(4) = mx + b
- mx + b
- m + b
- m
- b
- 3/2 and between 1 and 2
- Other
As you can see, even #8 is somewhat correct if we assume “between 1 and 2” is b. But the form does matter. It really depends on your philosophy on what the key distinctions are. I personally have chosen that anything in that has the form mx+b is all good, but something like “3/2 and between 1 and 2” would not be in the right form. In fact, it can even be useful to see that students who wrote in the form of y = mx + b has shown evidence that they may understand that f(x) can be equivalent to y.
And students who write f(x) = m + b may have made a simple mistake, others may need to be more careful (you could tell if its a trend or a one-off) and some may need some help understanding why the x is important. Same goes for the students who wrote f(4) = mx + b. What do they think that 4 means? All of these little details are important to help to understand your students and to help them. Because they may be on the right track and just need that final bit of coaching to grasp it fully.
Does it matter in what context you are given this type of question (table, graph, situation, points)?
We recently gave students questions around equations, rates of changes, and starting values in a variety of forms. (Questions below). Does it matter what context the question is in for the students?

And the difficulty level is a bit different for each. But when we look at students in aggregate, we do see some interesting differences.
| % Correct Rate of Change | % Correct Starting Value | % In Equation Form | % Correct Equation | |
| Coordinate Points | N/A | 32.16% | N/A | N/A |
| Table | 25.35% | 30.05% | 69.95% | 17.84% |
| Graph | 15.73% | 31.69% | 52.35% | 11.97% |
| Situation | 38.50% | 41.08% | 53.99% | 36.38% |
| Graph and Table | 29.81% | N/A | N/A | N/A |
Lots of interesting things to think about here. A lot of the students see the rate of change when written in a situation (to be fair it is given here), but they don’t write in an equation format when given that situation. However, when given a table they are well practiced at writing equations (even if they aren’t technically the correct ones). There is a lot of thinking to do around how to best engage different students.
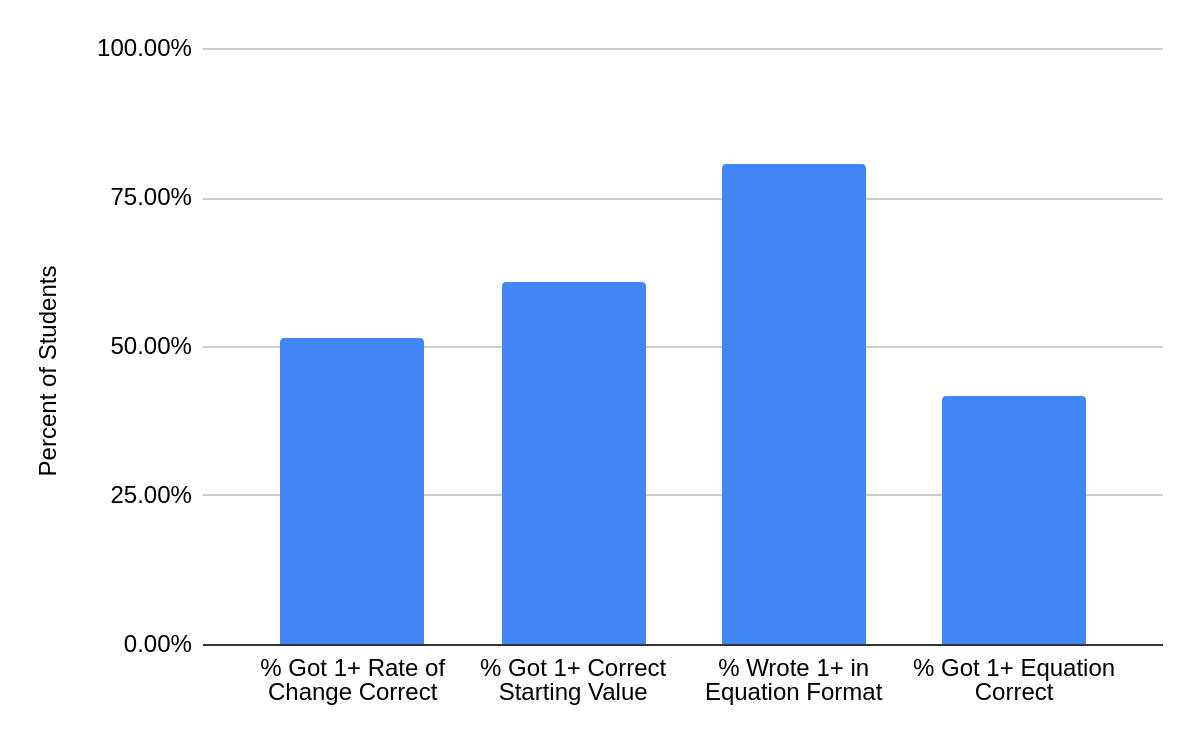
Let’s look at this data another way. How many students got something in one of the questions correct?

A lot of students got something correct! That is a totally different view than if you looked at an average score. Students have a lot going on, they are showing up, they are learning, sometimes we just have to look at what they are showing us! And once we can see what they are bringing to the table, we can work with them to improve.
I’d love to hear more about what you think about asset based, linear functions and how I can help. Contact us here or find us on twitter.