
Educators are bombarded with messages like “Your student is two grades below grade level”. Does that mean that you have two years of material to catch up on while you are supposed to keep up with the current grade level material? And if you don’t, does that mean you will soon be three grades below grade level? Or does the panic induced by that message mean something else?
For teachers, it’s even tougher. Somehow you are supposed to manage students floating between four or more grade levels simultaneously. If you’ve been trained and prepared to teach 7th grade math, but you have a class coming in with the skills between 4th and 8th, how are you supposed to manage that?
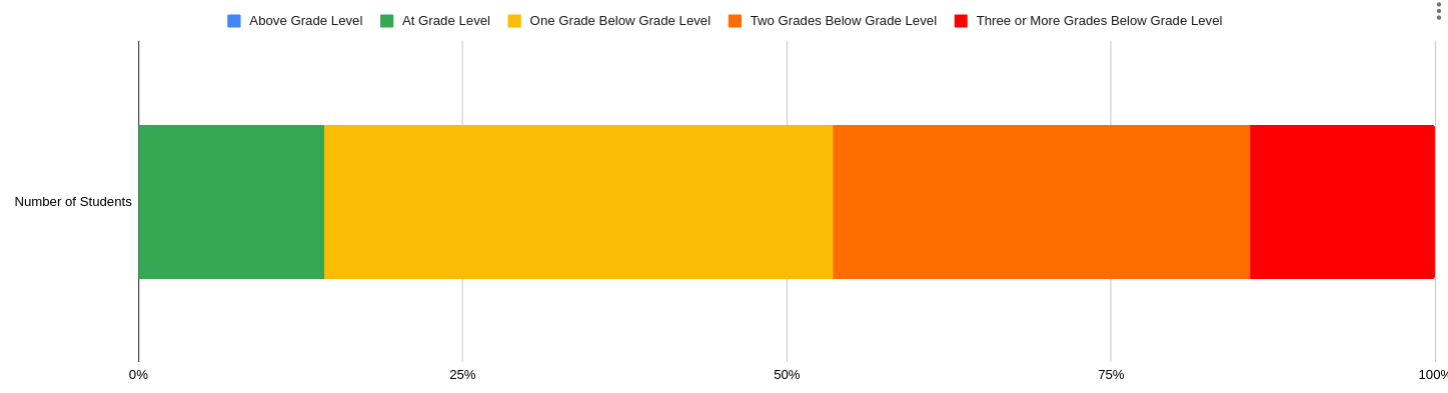
Below, you’ll see a grouping of students for a real classroom, that demonstrates this exact type of variability.

This isn’t uncommon. Understandably, the teacher of this class expressed some feelings of helplessness. This is why we find it so important to dig in and find out what “below grade level” really means.
In this case, we are going to focus on students who performed 2 grades below grade level in ratios and proportional relationships using a popular assessment tool. We aim to uncover what these students do know, and zero in on the precise areas where they need assistance.

The students in this class are 7th graders. Let’s first take a look at what they are expected to know in 7th grade and 6th grade. Then let’s look at where they were “placed” in 5th grade.
Referring to the Common Core Math Standards Document:
7th grade standards for ratios and proportional relationships cover one main topic: Analyze proportional relationships and use them to solve real-world and mathematical problems.
This includes:
- Computing unit rates associated with ratios of fractions, such as a person walking 1/2 mile per 1/4 hour
- Deciding whether or not two quantities are in a proportional relationship
- Representing the relationship in an equation
- Solving multi-step problems
6th grade standards for ratios and proportional relationships also cover one main topic: Understand ratio concepts and ratio reasoning to solve problems.
This includes:
- Using and understanding ratio language (per, each, every, 2:1)
- Understanding unit rate
- Solving real world and mathematical problems
5th grade does not have standards for ratios and proportional relationships.
There are some relevant things like analyzing patterns and relationships (5.OA.3) and converting between measurements (5.MD.1) — but to say a student is at a 5th grade level for ratios and proportional relationships must mean they met none of the 6th grade standards, right?
We gave this same class of students an asset-based assessment to identify what they do understand about ratios and proportional relationships.
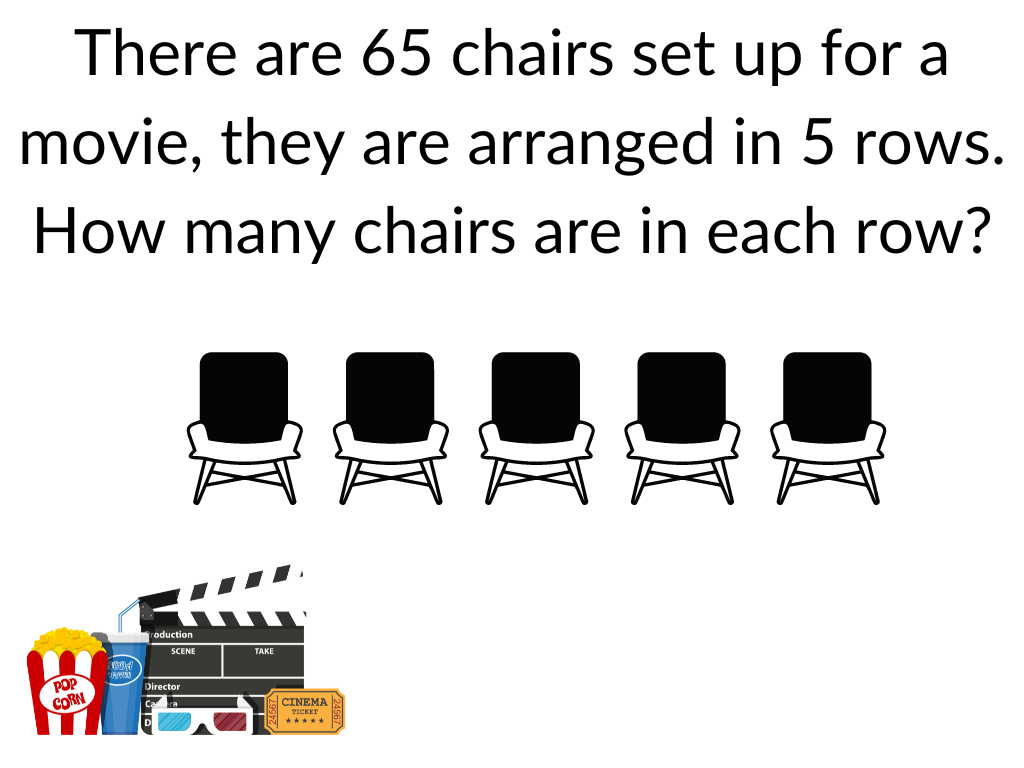
13 Chairs
Student A
13
Student B
So far, I agree with Student A and Student B. This represents a proportional relationship. Other students got answers of 70, 60, and 325. I think we are starting to see some evidence that Students A and B, who were “2 grades below grade level”, may actually know something about ratios and proportional relationships after all!
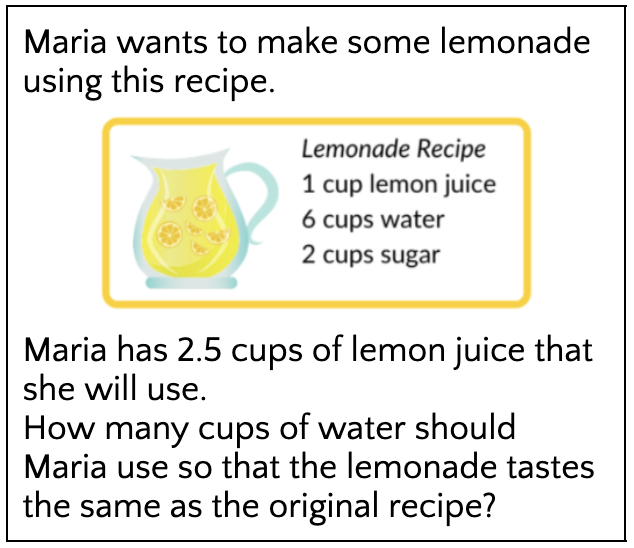
15 cups
Student A
7.5
Student B
Student A is still going strong and making some wonderful lemonade. Student B may be in for a sour surprise. With this second question, we’ve got more evidence that Student A has an understanding of proportional relationships. Student B however, is thinking about this additively. If you add an additional 1.5 cups of lemon juice, you can just add an additional 1.5 cups of water (6+1.5 = 7.5). So, potentially this student has some thoughts around when proportional relationships exist.
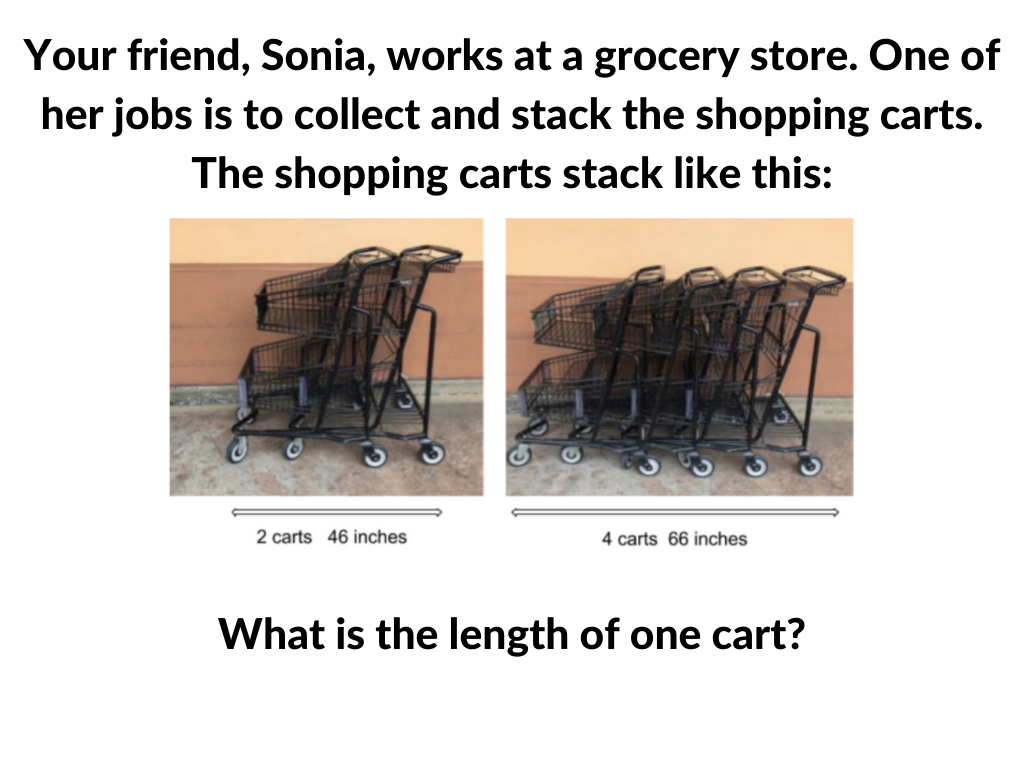
Extra context here: we asked them to explain how they got their answer. The explanations below are exactly as the students typed them.
“I saw it and I thought to cu it in half and got 23 because the one that has 2 carts I just cut it in half.”
Student A
“I saw the 2 carts and that was 46 inches and than I saw the 4 carts and that was 66 inches than I counted to 56 and I counted 10 more and got 66 and that’s how I got 10 inches for each cart.”
Student B
This is interesting!
While both of these answers are incorrect, we actually see a ton of evidence for proportional relationships. We also see the beginnings of identifying linear relationships for Student B, while student A strictly saw this problem proportionally.
For Student A, there could be some really great re-engagement lessons where we pose a version of the question where the carts are back-to-back. Why are two carts and four carts composed of “differently sized carts” in the question above, but would have the same sized carts when put back-to-back? What’s the difference?
Student B however, was onto something. While they didn’t get the correct answer, they did find the unit rate per cart and noticed that the growth rate was proportional to the number of carts. Maybe we can pose a follow-up question like “If one cart is 10 inches, how is two carts 46 inches?”
Let’s take a look at one more example question:
20 minutes
Student A
one hour.
Student B
Once again we see Student A working on a simple proportional relationship — not taking into consideration that this rate is fractional. But this assessment was given in September, and these students are in 7th grade, so this is something that they are supposed to learn this year. Seems pretty on track to me!
Looking at Student B’s response, we can see that they are doing very well here, and arrived at the correct answer.
What does “2 grades below grade level” really mean?
At this point, we’ve all looked at the data together. What conclusions can we make? What are you noticing and wondering?
For me, the first thing to take into account was what these students showed us. Student A seemed to have a great mastery of simple proportional relationships, yet potentially was still working on distinguishing between when things are proportional and when they are not. In addition, they were using unit rate all over the place, even to a fault, when we were looking at 1/3 of a mile instead of minutes per mile.
One thing to take into consideration though: I was presenting this topic and someone noted that kids usually aren’t walking a mile to school, so potentially the student thought one hour was unreasonable and 20 minutes was more likely. We have no evidence for or against that, but it is something to consider for further inquiry.
Student B seemed to be navigating a ton of different relationships. From finding proportions, even fractional ones, to linear relationships between quantities, to finding the rate of change in a linear relationship. However, they didn’t seem to have a mastery of when to use each relationship, and potentially had some confusion around the context of a rate in a linear relationship.
Both students were labeled as “2 grades below grade level” by the popular assessment tool. We can probably all agree that they have some learning to do, but they have different understandings of the content that require different approaches to help them learn. Additionally, they are only a couple of concepts away from being “at grade level” or even “above grade level”. We are only at the beginning of 7th grade, so fractional rates and linear relationships aren’t closely held content yet. So to me, it seems like the label “2 grades below grade level” is problematic in two ways. One, it does not provide information that we can act on to help the students improve. And two, it also creates panic that there is a massive amount of work to do, when in reality, it might not be such an uphill battle.
Now it’s your turn, what do you think “2 grades below grade level” really means? And how are you going to rethink your own classroom’s scores?
P.S.: If you want any help to better understand your students, please reach out. You can contact us directly or via twitter.