
In the last couple weeks, we were able to explore a little bit about how students think about function notation. We looked at 4 different questions to understand how they were thinking. Using a graph, can you solve f(x) given an x value, given the value of f(x)? How about using a table? And finally, do they understand what f(x) means in a context.
Before jumping into the details of how they thought about each topic, I want to share the results of how much students grew in the course of a week because it is just so exciting to see that with the right help, students can really change quickly! So, without further ado…

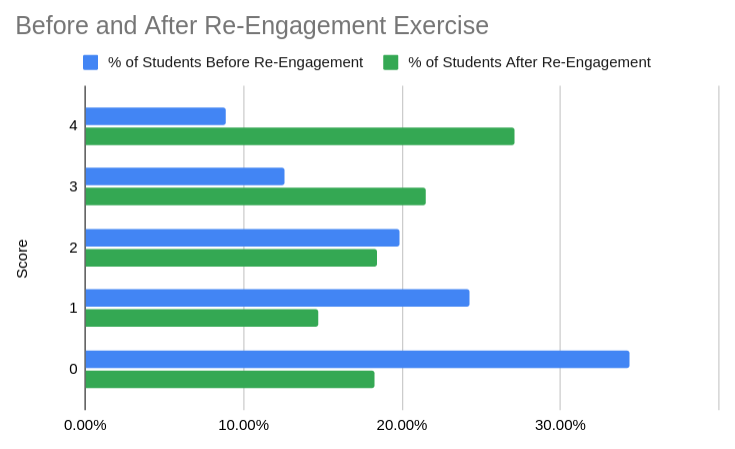
Quick reference, the score is just a simple measure of how many the students got right. Which I think can be very useful for modeling a type of growth (in getting the right answer), but is not an indicator of overall growth or anything like that and absolutely not how I would measure any single question.
Let’s look at each type of question.
Question 1: Given the graph of f(x), what is the value of f(5)?

The most common answer we got was -1, which is correct! So, that was great to see. And we also got it in a variety of forms: -1, (5,-1), f(5) =-1. And some that were on the right track, but a little lost on some notation: (-1,5), (0,-1), f(-1). Those are close, but could use some guidance on writing out more formal math answers. But totally on track! Unfortunately, this only represented about 37% of the students.
Some of the next most common answers were things like the x-intercept, the y-intercept, the value of x (“x = 5”), and even a few kids getting 20 (solving correctly for f(x) = 5!). After that, there seems to be a lot of choosing points on the graph like (4, -1.4) and some attempting to write the equation for f(x).
Let me start off by saying, whether or not they got the right answer, we have absolutely tons of students showing off math skills in a variety of ways, such as writing coordinates, equations, fractions and more. And that’s important because it gives us a place to start!
We’ve found that showing students what their answer is and what is means is a way to re-engage and then help move them to the right answer next time, so we always like to keep track of and understand any answer given by a student!
Question 2: Given F(x) = 1, solve for X.

As expected, this one was much harder for the students. Only 23% of students got 10. And a large amount of students gave the answer 1, possibly due to conflating the idea of solving for x and f(x) to be equivalent. We also saw some more versions of the x-intercept and y-intercept, and some students went with solving f(1).
Once again, lots of mathematical thinking, just not totally understanding what the question means or how to solve it.
Question 3: Use the table to solve for F(50)

For this problem, we go back to the idea of solving for f(x) given some x. However, instead of using a graph, we use a table. If every student understood graphs and tables as different but equivalent displays of information, we’d expect to see them to get it right about the same amount of time. (37%). However, 41% get it right here, a slight bump. But are these the same students? Mostly not.
Those that got the graph question correct got the table question correct ~60% of the time and only represented 43% of the students who got this table correct. So, a variety of students feel comfortable on different mediums of data display.
As for the other ways that students approach this problem. 15% answered for f(x) = 50 and solved for x. We also saw a variety of answers around the growth rate on the table, about 12.5% answered either the growth rate of x (20) or the growth rate of y (24). We saw things like 50×74, 50×24 (x value times y growth) and 50 + 74, and finally pulling a few numbers from the table as likely guesses.
Lots of use of math, just not in the way we had hoped. But plenty of space for re-engagement!
And finally, we asked:
Question 4: What does F(90) = 96 mean in the Context of Minutes Studied and Exam Grade.

We broke this down into 5 categories of how students responded.
Contextual Analysis – These students talked about how f(90) = 95 means that the students studied for too long, that the linear pattern broke or how the data was incorrect because it didn’t follow the pattern outlined in the table.
The more you study, the more likely you’re going to pass, but if you study to much, the less your exam grade will be.
Anonymous Student
Correct Context – Students here wrote very directly the meaning of f(90) = 95.
for 90 minutes studied a 95 was scored
Anonymous Student
The More You Study, The Higher The Grade – In this way of explaining, students wrote about the pattern in the table, but nothing about the context of f(90) = 95.
the minutes studied grows by 20 minutes and the exam grade increases by 24
Anonymous Student
Partial Context – These answers revolved around talking a bit about the context, or maybe what 90 or 95 meant, but not both.
they studied 90 min
Anonymous Student
Incomplete Evidence – These students either didn’t write much or something without context.
It means that the input of 90 will always have an output of 95
Anonymous Student
From here, I looked at how students performed on the previous question based on how they think about the context of the function.

And you can see a huge change in how students did based on how well they can explain the context. I thought it was quite interesting that the students who went above and beyond the context to explain how that effects the pattern on a table were so likely to get the table lookup question correct. And I found it quite fascinating that only 67% of students who could explain the context quite clearly got the previous item correct. It does go to show you how important understanding the mathematics in relation to what it means is, but also how there is some confusion between the different representations of data.
Re-Engagement
This re-engagement, we really focused on those the graphs, helping students to document what they knew given the problem and what they were trying to figure out as well as some practice about writing coordinates on the graph in function notation.
Check them out below!
And it really worked! About 33% more students got both the first two graph questions correct. (about 150 students in our case). 10% more got the table question right and 16% more got the context right. All in all a big improvement. Definitely more work to be done, but a fantastic start.
Next Steps
If I were to do it again, I would love to have a more comprehensive view of the students knowledge about using functions. Given an equation, a graph, a table or a pattern, can they see the relationship between f(x) and all its different representations? What if we used y instead of f(x), how much does that change?
And then build re-engagement unique to each students abilities. As we saw, some students seem to get the graph easier than the table. That means we could do a better job at grouping some students together to help them see how all the representations are connected and what f(x) means in each context.
If you liked this post, check out the previous one in the series about Student Thinking In Graphs And Patterns as we work with Integrated 1 Students.
If you’d like to get in touch or follow along: