
At Math ANEX, it has been our philosophy that there is a lot more to mathematics than computation. We believe that understanding student thinking is the crucial next step in math assessment. However, it has been a long journey trying to figure out how to measure the connection between the ways students make sense of mathematics and how they answer questions on an assessment.
In general, we consider how students are thinking about a question and assign different “ways of thinking” to their answers and/or mathematical explanations.
For example, let’s look at the question below about art tables.

Looking across thousands of student responses, the most common answers are: 9, 8, 132, 29, 27, 8.25, and 11. One of the interesting things here is that not a single one of those answers is computationally incorrect. This begs the question, how did students come up with these answers? Can we figure all of them out?
Let’s check in with some students to see how they explained how they arrived at their answers. As you read these explanations, consider this question: What did these students make sense of and what did they not make sense of in the problem?
“33/4 = 8.25 but you can’t have part of a table so you round up to 9 so all kids can sit!”
Student who answered 9
“Well 8×4=32 but 9×4=36 I dont know if i can leave one student lonely or they are sitting on a floor. I guess that’s ok”
Student Who Answered 8
“Because I know the keyword each means multiplying and 33×4=132″
Student Who Answered 132
“first I added 33+4 and got 37 so the art teacher has to buy or order 37 tables.”
Student Who Answered 37
“I found the answer by subtracting 33 and 4. I tried multiplying, adding, dividing but then none of those answers work, so I tried subtracting.”
Student Who Answered 29
“I know the Art teacher needs 8.25 tables because there is no exact amount so the art teacher needs 8.25 tables for the students but there will be an empty table, Therefore the Art teacher needs 8.25 tables.”
Student Who Answered 8.25
And my favorite answer here: 11.
“4×8=32 and 3×11=33 so your not going to do 4×8 he has 33 students and 4 tables its not possible but if you do 3×11 it equles to 33 so he can 11 tables with 3 students in each table.”
Student Who Answered 11
Of course, the “correct” answer is 9, although depending on your school budget, 8 is a good way to save a little money and 11 is a nice splurge. 8.25 however would be an art project in and of itself!
However, did you consider what students did and did not make sense of in each response. What assets are they demonstrating? What DO they know? In our methodology, we usually categorize these different answers into different “Ways of Thinking”.
Students who answer 9 are thinking about grouping students by tables and then interpreting the remainder of the extra student by rounding up to make sure every student has a seat. Students who answer 8 are also thinking about grouping students, but aren’t so sure about what to do with that remaining student. Do they leave them to sit on the floor? Some other students even mention that usually at least one student is absent, so you don’t need to account for them, which is quite realistic. But in many cases, I’d say those students aren’t quite making sense of the general question constraints/context, which would be making sure that on the day when every student shows up, they all have a place to sit.
So, we can figure out a bit about how each individual student is making sense of the problem and where they could use some support. But another way is to look at how students who answer a certain way are performing in general.

Here we can see a quantitative difference between the answers. Combining that with the student responses above, we can tell that there are different levels of sense making here. I would say that the answer 9 is making sense of the question context and units (students divided by students per table equals tables) and they got it computationally correct.
Answers 8.25, 8 and 11 are making sense of the units as you can see from the students above, but, while they are all computationally correct, these students aren’t making sense of the question context.
Answers 132, 29 and 37 are all computationally correct, but aren’t making sense of much else. And for the folks who noticed that 122 mixed in to the chart, that is a computationally incorrect version of 132. There were only about 20 students who got 122 versus the hundreds of students with 132, so there is variability not accounted for there. But this goes to show how some of the similar incorrect calculations of a specific way of thinking relate to overall performance.
One other thing to note here is that there is a bit of a difference between answers like 8.25, 8 and 11 and then 132, 29 and 37. I believe that this has to do with different levels of computational strategies/tool usage. Below, we’ll take a look at all the students who got the answer 9, but used different computational tools to solve it.
Counting: Each table can hold four students, so I counted up. 4,8,12,16…
Repeating Addition: Every table has 4 students, so add until we get 33 students. 4 + 4 + 4 + 4 + 4 + 4 + 4 + 4 = 32, + 4 = 36. 9 tables.
Repeat Subtraction: We can take away 4 students for each tables. 33 – 4 – 4 – 4 -4 – 4 -4 -4 -4 = 1. And one more table for the last student.
Multiply and Check: 4 x 10 = 40, that’s too much. 4 x 8 = 32, too few. 4 x 9 = 36. 9 tables.
Division: 33/4 = 8.25 but you can’t have part of a table so you round up to 9 so all kids can sit!

As you can see, using more advanced tools also correlates to a better performance on the state assessments.
I believe this explains the difference in state test scores between students getting the answer 132 and 29 or 37. I would also imagine we would see a higher percentage of students who wrote 8.25 using division than we would see in students who submitted the answer 8. So, within sense groups, different tools will contribute to the level of sophisticated computational thinking students have and thus will relate to their state test scores.
Results
With the idea of highlighting sense-making, I tagged 16 of our assessments, (each with about 8-12 questions) with the ways that students made sense of a problem. In each case, I was careful to make sure that sense-making was tagged to an incorrect answer as well to make sure I was thinking through it properly.
Let’s look at an example:

In the problem above, students have to make sense of a lot of things. First off, mathematical language. “Area” is a specific word in math that would be how many squares of a certain unit cover the shape. Or perhaps you are more familiar with the formula for area of a rectangle A = LxW. In the case of knowing the formula, you have to make sense of what the dimensions L and W are, and in this case, we don’t have a rectangle.
Because we don’t have a rectangle, students need to make sense of Physical Space. Either calculating missing sides or decomposing and recomposing the shape.
In this problem, the top student answers include:
— 30 (adding all the visible numbers together)
— 62 (the correct area)
— 36 (the correct perimeter)
— 35(a miscalculated perimeter)
— 80 (an area larger than the shape multiplying together the largest length and width)
For 30, I concluded that these students were computationally correct, but didn’t make sense of the physical space or the mathematical language.
For 62, students correctly made sense of the language and physical space and were also computationally correct.
For 36, students made sense of physical space, including the sophisticated step of utilizing the information given to find the missing side length to include in the perimeter. However, it does not make sense of the context of the problem regarding the mathematical language of area. Still, it is computationally correct. 35 is the same, but is computed incorrectly.
For 80, students made sense of the mathematical language, since they did calculate area, but they did not make sense of the physical space of the complex shape.
Below are the current types of sense-making I’ve defined. I don’t believe this is a comprehensive list, it still needs some work, but I believe it is progress in the right direction. I also believe knowing these ways of thinking about students and how they are making sense of a problem is useful and actionable for teachers. Feel free to reach out if you would like to include new types of sense making or update what I currently have!
Types of Sense-Making
Mathematical Language and Syntax: This includes things like sum, least common multiple, common denominator, area, perimeter, derivative, integral, median, average, mean, standard deviation, variation, etc. As well as +, -, /, x, and =.
Units: Units includes both answering in the unit that is asked for (asked for square feet and gave square feet) as well as good unit math, (aka don’t add meters per second and dollars, unless you were asked an odd question like “what is the sum of all the numbers in the problem”).
Contextual Numbers: This includes answers that answered a different question than was asked. Quick example: What is the total price you would pay for an $80 shirt that was on sale for 40% off. An answer of $32 is correct computationally and in units, but is contextually inaccurate as that is the amount of the discount as opposed to the price you are paying.
Patterns: Patterns includes students correctly identifying a growth pattern or other patterns in the questions asked of them. For the time being, I have included different types of relationships inside of patterns. For example, correctly identifying a proportional relationship vs. a linear relationship vs. an exponential relationship.
Physical Space: Physical space was targeted towards geometric problems. In making sense of shapes and anything related to 1d, 2d, and 3d shapes.
Diagrams: Diagrams were in the space of reading and interpreting diagrams. This came up with number lines, graphs, charts, etc.
Parameters: I did not include this in the questions I tagged, but this would include mapping the parameters of a function to the numbers they represent. For example, given the slope and intercept, could you write an equation in the form y = mx + b. Popular equations could include the pythagoream theorem, area and volume formulas for different shapes, trigonometry, etc.
And here is the earlier work on my thinking in how students are making sense.
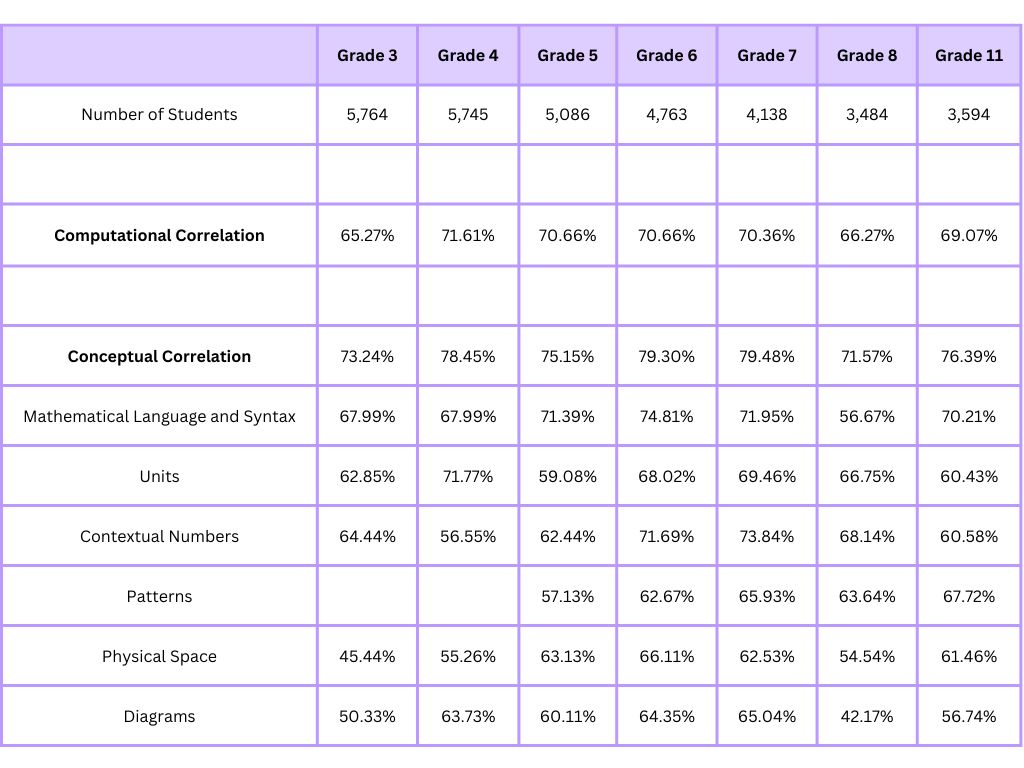
After analyzing all these assessments and giving each student a metric on their sense making for all of the different types above, I looked at their correlation to the state test scores. We see a strong correlation between the individual types of conceptual sense-making, and when combined together, these become highly correlated to state test results. This was done with tens of thousands of students over multiple semesters and school districts.

Definitely take some time to notice and wonder about the table above!
All in all, across the board, we can see that sense-making is more correlated to student success than computation. And when you look at answers to individual questions, like we did above, you can see why. Not many students have trouble with computation after 3rd or 4th grade. From then on, it is about deeply understanding how to model the world around you and understanding what is being asked of you in a math question — which is also likely why the conceptual correlation increases as students progress up the the grade levels.
But the most exciting thing about these findings are the implications for where we can take this.
The Future
The implications of being able to measure how students make sense of mathematics is incredible.
- We could better align superintendents, principals and teachers and each of their goals in education. Since sense making can be shown to be a better use of time to improve state test scores, principals can more easily align with teachers to make more interactive classrooms where sense making is central to learning instead of drilling skills, standards and worksheets.
- We can look at classroom level data to understand what type of sense making students could use the most help with. And we can use math language routines with whatever topic we are covering in class to deepen students’ understanding.
- We can see where an individual student has opportunities to make more sense of the world and work with them on understanding something that will benefit them across all math topics.
- And we can measure growth in our students even if they get a question incorrect.
If you’d like to start thinking about this in your school or district, or if you have any other questions, please reach out or follow us on twitter!